Faciotopy: The occipital face area might be a face-feature map with face-like topology
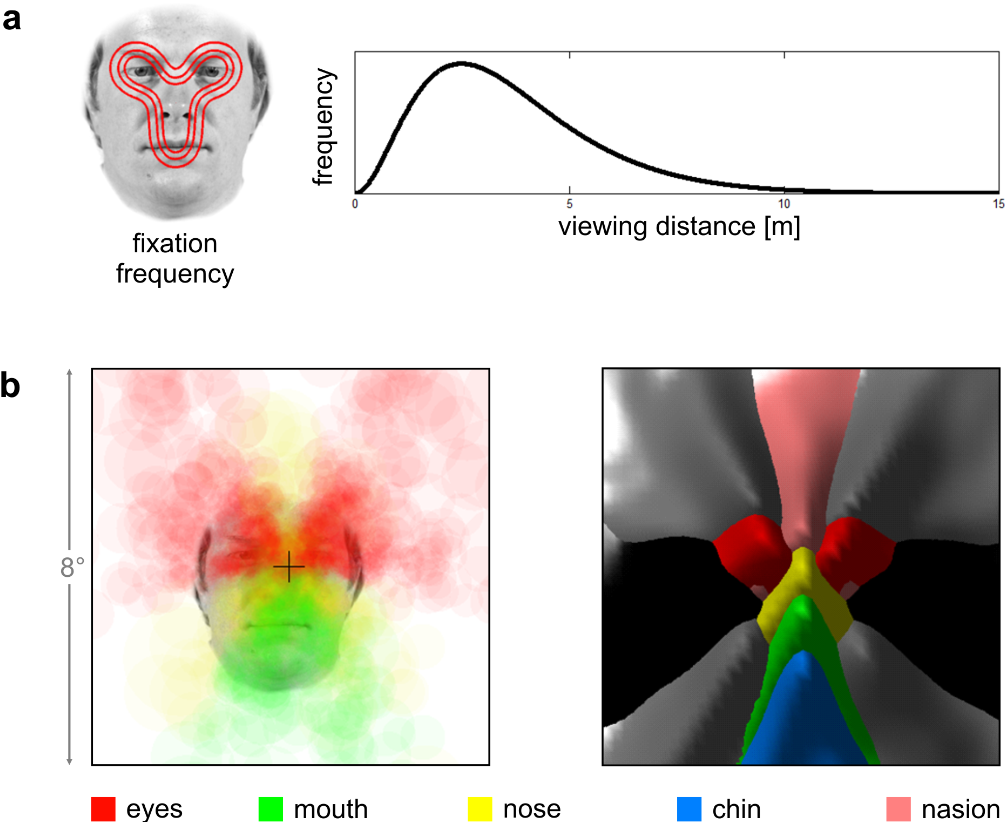
Toy simulation of retinal feature exposure in natural experience. A simple simulation suggests that although each face feature will fall in a wide range of retinal positions in natural experience, retinal feature exposure maps still reflect the geometry of a face. a) The left panel shows an idealized frequency distribution of fixation locations on faces. The distribution is based on face fixation measurements from the literature (Hsiao & Cottrell, 2008; van Belle, Ramon, Lefevre, & Rossion, 2010) and visualized by three isoprobability-density contours (red) on an example face. The right panel shows an assumed distribution of viewing distances (Gamma distribution). b) We simulated natural retinal exposure to faces as random independent draws from the fixation-location distribution and the viewing-distance distribution, assuming that the height of a face is 12.5 cm (chin to eye brows). Each draw from the distribution exposes the retina (and thus the cortical retinotopic protomap) to each of the face features at a certain location. Both panels show retinal maps of natural face feature exposure. In the left panel, the feature exposures are visualized on the retinal map (fovea indicated by cross) by transparent disks whose size reflects the size of the face (resulting from the viewing distance) and whose color codes the face feature (color legend at the bottom). In the right panel, the size of the retinal face projection is ignored and the exposure frequency distribution over the retina is visualized for each feature (colors) as a surface plot (frequency axis pointing out from picture plane). The right panel includes all 12 features used in this study. Gray and black code for the outer face features: hairlines, ears, and lower cheeks, as shown in Fig. 2a.
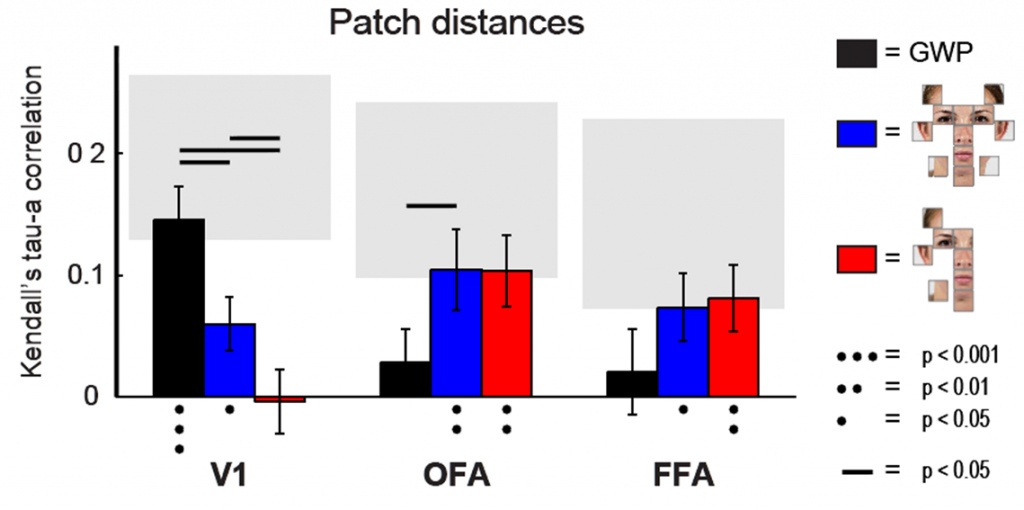
Evidence for faciotopic representation in OFA. A single patch of cortex was estimated for each face-feature based on the feature preferences. The relative distances between the face-feature-preference patches were compared to three model representations (black, blue, red). In OFA, the physical distances between the face-features significantly explain the distances between the face-feature-preference patches along the cortical surface (blue bars), reaching the noise ceiling of the patch-distance estimates.
References
Faciotopy—A face-feature map with face-like topology in the human occipital face area Henriksson L, Mur M, Kriegeskorte K. (2015) Cortex 72: 156-167.![]()

 MRC Cognition and Brain Sciences Unit


