MATLAB scripts for processing infant eyetracker data
For copies of any of these scripts please email: me sam.wass[at]mrc-cbu.cam.ac.uk.
Fixation parsing scripts.
What’s the problem with fixation parsing using algorithms designed for adult data?
The quality of the eyetracking data is much lower in some infants than in others. In this paper we describe analyses showing that when standard dispersal-based fixation detection algorithms are used to parse eye-tracking data obtained from infants, their results are strongly influenced by data quality. Poorer quality data obtained from some infants (because they are fidgety or because they are not sitting in an optimal position relative to the screen) can appear to indicate shorter fixations. We also present fixation parsing algorithms designed to be independent of data quality by including a number of new post hoc verification checks to identify and eliminate artifactual fixations. These algorithms are now updated to be optimised for data from Tobii X2-60 and TX300 eyetrackers. I also have older versions optimised for Tobii 1750 and T120s.
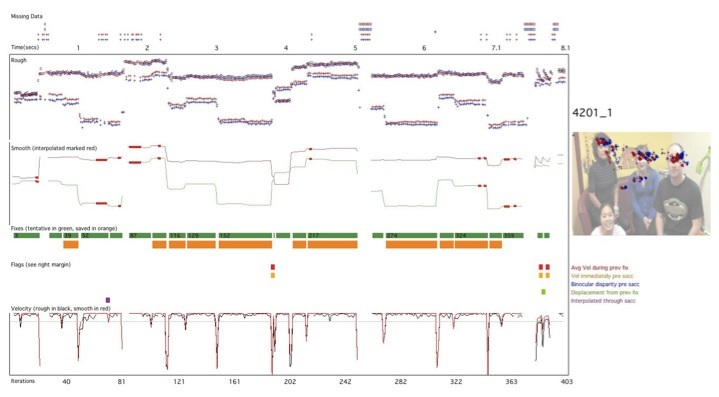
A sample screenshot from the output. The thick red and blue lines show the raw infant data obtained in this 15 second sample (red left eye, blue right eye), the thin red and green lines show the data after smoothing and interpolation. The thick green bars show the provisional results returned after standard velocity-based thresholding and the orange bars show the final fixations accepted by the algorithm after all the post hoc checks described in the manuscript have been applied.
Live calibration using the T2T toolbox
I have adapted the Matlab SDK from Tobii to add an an infant-friendly calibration sequence in Psychtoolbox. This allows for live gaze-contingent interface for experimental presentation for any Tobii eyetracker using Matlab and Psychtoolbox.
Data quality parsing scripts.
The quality of the eyetracking data is much lower in some infants than in others. Data quality can vary systematically between different individuals, and also within individuals over time.
In this paper (with Tim Smith and Mark Johnson) and this paper (with Linda Forssman and Jukka Leppanen) we present analyses showing that lower precision data can appear to manifest as shorter fixation durations and a reduced likelihood to look at the eyes in a face relative to the mouth. We also show that less robust tracking may manifest as slower reaction time latencies (e.g. time to first fixation), shorter first look/visit duration and shorter fixation duration.
We have written Matlab algorithms for quantifying data quality, that are available for use with any eyetracker. Please email me if you would like a copy of these.
The two parameters of data quality that they analyse are precision and robustness.
Precision. Precision (or consistency) refers to between-samples consistency in the reported POG.
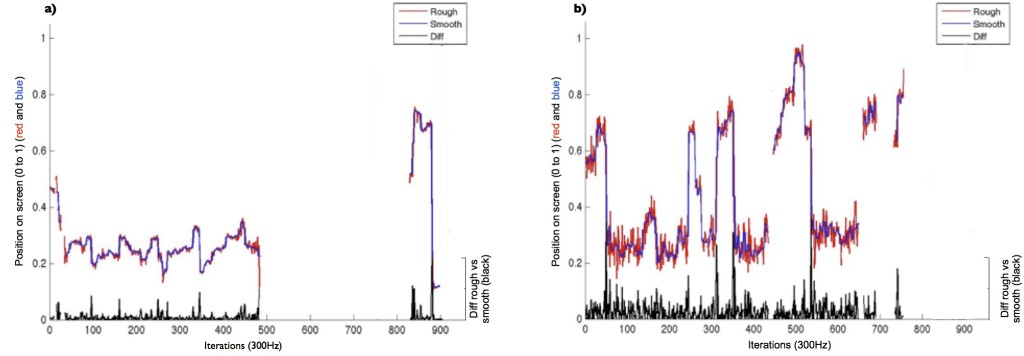
For each sample the red line shows the raw data, and the blue line shows the low-pass-filtered data. The black line (separate y axis) shows the difference calculated iteration by iteration between the smoothed and unsmoothed samples. The average (median) difference was calculated as our precision measure.
Robustness. Robustness is the relative proportion of periods of data presence vs absence during recording. Eyetracker data obtained from infants is often flickery, with periods of data loss ranging from 3 ms through to thousands of ms.
Two 30-second samples of 50Hz data are shown. The blue diamonds show the raw data; the red circles show the data for which a successful interpolation could be performed. The yellow bars, along the x axis, show the fragments of usable data obtained. The mean duration of these fragments (in ms) is calculated to quantify robustness.
A third important parameter of data quality that we do not address in this paper (but see e.g. here for an in-depth discussion) is spatial accuracy.
Spatial accuracy. Spatial accuracy (or offset) refers to systematic discrepancies between actual and reported POGs.
The difference between spatial accuracy (or offset) and precision (or consistency). a) and b) show samples of data recorded during a post hoc calibration check (using techniques similar to those described in Frank et al., 2011), on a TX300 with typical 12-m-o infants. In each plot, time is represented on the X axis and reported POG (just in the X dimension) on the Y. Red shows the position of a small object (subtending c. 0.4 deg) presented on-screen; blue shows the POG reported. Sample a) shows a systematic but consistent discrepancy between actual and reported POG (particularly for the target presented at 0.8), but the variance between samples is low. This sample therefore shows relatively low spatial accuracy but high precision (consistency). In sample b), in contrast, the reporting of the POG appears more inconsistent. This sample therefore shows low precision (consistency).

 MRC Cognition and Brain Sciences Unit


